Friday, July 31, 2020

Pandemic and Macroeconomic Outlook INDIA

Panchanan Das
Professor of Economics
Department of Economics
University of Kolkata (financial blog on behalf of GLARiUS – www.glarius.com)

GLARiUS Markets Intelligence (www.glarius.com) provides tools, prognoses and graphs to monitor performances of economies, countries and stock markets worldwide.


The nature of recession today because of the outbreak of COVID-19 is completely different from that of the Great Recession of the 1930s. Macroeconomic risks brought on by the pandemic could be even more severe.There is a trade-off between the severity of the recession and the health consequences of the pandemic.The containment policies undertaken by the State in most of the countries including India in the form of economic lockdown primarily to maintain social distance exacerbate recession but raise welfare by reducing the probability of new infection and death toll caused by the pandemic.Different sectors of the economy will be affected adversely depending upon its intensity, spread and duration of the pandemic.
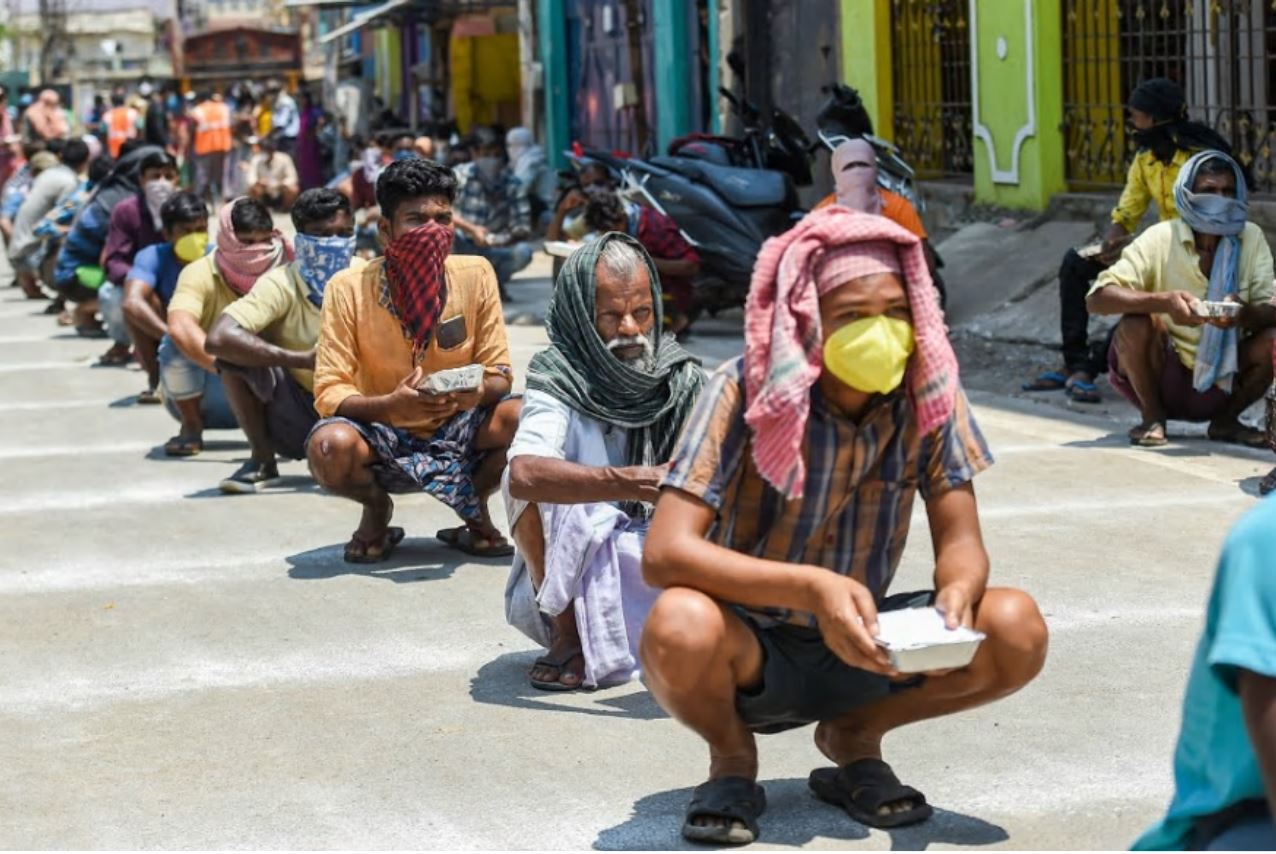
Till now, as the cost of externality is very high because of absence of vaccination and treatment of this disease, the State has to impose more aggressive policy in the form of near complete lockdown or in some cases complete lockdown of the economy to reduce the probability of being infected. Total number of infected people and number of death due to this disease is significantly less in India till now despite the country has the highest population density and more populous than USA and Italy. But,daily growth rate of infected people is significantly higher (above 10 per cent) than the rate even in USA (3.5 per cent) as on April 19, 2020. In India, although absolute number of death is the least compared to other countries, the death rate is larger than the rate in USA, the country showing the highest death toll in the pandemic.

RELATED: 'Chasing the virus': How India's largest slum overcame a pandemic


Global supply chains, trade, transport, tourism, and the hotel industry have been affected severely  because of the pandemic. The WTO (World Trade Organisation) indicated a declining trend in world trade volume in the early 2020, and is expected to be debilitated further by the adverse shock of the health crisis. The OECD (Organisation for Economic Cooperation and Development) estimates suggest that if the shutdown continues for three months with no offsetting measures, annual growth of global GDP could be between 4-6 percentage points lower than it otherwise might have been. In that case, the growth rate of real GDP would be negative for many countries during the post-pandemic regime. The IMF’s latest assessment is also roughly similar: global growth could be lower by 3 percentage points or more in 2020 relative to 2019 because of the outbreak of COVID-19 (IMF, 2020). The global economy is expected to collapse into greater recession in 2020. 
Indian economy, as for the economy of other countries, has experienced a significant structural break at the beginning of the last quarter of 2019-20 directly because of lockdown of the domestic economy and indirectly by the global recession because of the outbreak of the COVID-19 pandemic. Spill overs are also being transmitted through domestic and global financial markets. These effects would accentuate the growth slowdown which started since the first quarter of 2018-19 in India (Table 1).
Table 1 Quarterly growth rates of real GDP at market price
Components of GDP
2018-19
2019-20
Q1
Q2
Q3
Q4
Q1
Q2
Q3
Q4*
Private final consumption expenditure
6.7
8.8
7
6.2
5
5.6
5.9
4.9
Government final consumption expenditure
8.5
10.8
7
14.4
8.8
13.2
11.8
4.9
Gross fixed capital formation
12.9
11.5
11.4
4.4
4.3
-4.1
-5.2
2.5
Exports
9.5
12.5
15.8
11.6
3.2
-2.1
-5.5
-2.8
Imports
5.9
18.7
10
0.8
2.1
-9.3
-11.2
-3
GDP at market prices
7.1
6.2
5.6
5.7
5.6
5.1
4.7
4.7
Note: Projected growth
Source: National Statistics Office

A sequential slowdown started in the Indian economy from first quarter of 2018-19 and the growth rate reached below 5 per cent in third quarter of 2019-20 (Table 1). The widening incidence of COVID-19 will produce the downward pull further. Private investment measured by gross fixed capital formation (GFCF) showed actual fall in the second quarter of 2019-20 and the rate of fall increased in the next quarter. Negative growth was observed in foreign trade (both exports and imports) during this period as well. The decline in merchandise exports started in second quarter of 2019-2020 because of the fall in shipment of engineering goods, gems and jewellery, cotton and handloom products. 
 Positive growth in aggregate demand is sustained by consumption demand driven mainly by the upward movement in government expenditure (GFCE). The slower growth of consumption expenditure on final goods by the households (PFCE) in 2019-20 as compared to previous financial year was caused by the deceleration in real wages and downturn in labour-intensive exports. Demand for consumer durables like small passenger vehicles continued to decline in February 2020. The rise in revenue expenditure partly due to pay hike by the 7thPay Commission and decline in gross revenue under corporation tax deteriorated fiscal deficit of the central government during 2019-2020. 

On the supply side, the slowdown in growth of gross value added (GVA) was caused by the deceleration in industrial and services activities (Table 2). Agriculture and allied activities, on the other hand, accelerated in the second half of 2019-2020. Industrial deceleration led by the manufacturing sector deepened the slowdown because of low domestic and external demand. Services sector activities contributed the most to (GVA) although its growth rate declined in 2019-20. Agriculture and allied activities also provided momentum to some extent to GVA in second and third quarter of the past financial year. The industrial sector remained declining because of low demand conditions. 
Table 2Quarterly growth rates of real GVA at basic prices
Components of GVA
2018-19
2019-20
Q1
Q2
Q3
Q4
Q1
Q2
Q3
Q4*
Agriculture, forestry and fishing
3.8
2.5
2
1.6
2.8
3.1
3.5
5
Industry
7.8
4.7
4.4
1.4
3.2
0.1
0.1
2.3
Mining and quarrying
-7.3
-7
-4.4
-4.8
4.7
0.2
3.2
2.6
Manufacturing
10.7
5.6
5.2
2.1
2.2
-0.4
-0.2
1.8
Electricity, gas, water supply and
7.9
9.9
9.5
5.5
8.8
3.9
-0.7
6.5
Services
7.3
7.2
7.3
8.3
6.7
6.8
6.4
6.1
Construction
6.4
5.2
6.6
6
5.5
2.9
0.3
3.2
Trade, hotels, transport, communication
8.5
7.8
7.8
6.9
5.7
5.8
5.9
5.1
Financial, real estate and professional services
6
6.5
6.5
8.7
6.9
7.1
7.3
8
Public administration, defence and other services
8.8
8.9
8.1
11.6
8.7
10.1
9.7
6.7
GVA at basic Prices
6.9
6.1
5.6
5.6
5.4
4.8
4.5
5
Note: Projected growth
Source: As for Table 1

RELATED: Coronavirus vaccine: India has a 'big' role to play, projects are being fast-tracked

The lockdown of the domestic economy in the wake of the outbreak of COVID-19 has disrupted manufacturing activities which experienced negative growth just before the outbreak (Table 2). In the manufacturing sector, dislocations of labour adversely impacted automobiles, electronic goods and appliances, and apparel. Services such as trade, tourism, airlines, the hospitality sector and construction have been affected badly in a greater extent.
The conventional signals for forecasting are heavily conditioned by the depth, spread and duration of COVID-19 and other characteristics of the pandemic, and forecasting at this moment is really a challenging task(Ferguson et al. 2020). However, it could be easily understandable that the slowdown could be more long-drawn-out in the awful situation as the duration of COVID-19 extends longer. Different sectors of the economy will be affected adversely depending upon its intensity, spread and duration of the pandemic. According to World Bank’s estimate, the expected growth rate of India's economy would be around 2 per cent during 2020-21 fiscal year. Asian Development Bank has estimated that growth rate of India's economy reduced to 4 percent during this period. 

GLARiUS Markets Intelligence (www.glarius.com) provides tools, prognoses and graphs to monitor performances of economies, countries and stock markets worldwide. 

Wednesday, May 6, 2020

Finance in the post-COVID-19 World


Panchanan Das
Professor of Economics
Department of Economics
University of Kolkata (financial blog on behalf of GLARiUS – www.glarius.com)

GLARiUS Markets Intelligence (www.glarius.com) provides tools, prognoses and graphs to monitor performances of economies, countries and stock markets worldwide.

The outbreak of coronavirus (COVID-19) brings about extreme uncertainty in our economic and social life by carrying a novel risk.Global financial markets have turned volatile and experienced episodic meltdowns since early March, 2020. The health crisis has been transmitted into a financial and economic crisis incurring terrible collateral damages. This crisis has caused a huge shock in the financial market. As financial markets are driven by algorithms designed by humans, individual investors behave like Keynes’s ‘beauty contest’: investors speculate on what others would speculate. 
The first phase of the crisis started in early January, 2020, after the Wuhan incident in the form of pneumonia outbreak as China reported for the first time to the World Health Organization (WHO). Rational investors started to anticipate, at least partially, about the faith of the global economy as declining trend started in investment in the transportation industry during this early phase. The next phase of the crisis started after publishing the first assessment of the Wuhan incident by the WHO during third week of January 2020. The stock market started to experience the shock internationally because of the outbreak of coronavirus. The current stage started since the end week of February, 2020, when Italy declared lockdown in its most productive region. Selling in the stock markets along with buying in supermarkets jumped up significantly in Europe.  

RELATED NEWS:

The severity of the crisis prompted the Federal Reserve to cut down the emergency rate on March 3, 2020. The central banks in Canada, the UK, Australia, New Zealand and many other countries followed the similar move to ensure adequate liquidity. Equity markets in many countries in the developed as well as developing world suffered the worst during March 9-16, 2020. Bond yields fell sharply, most noticeably in the US where the 10- year benchmark yield fell below 1 per cent. The Dow Jones Industrial Average (DJIA) along with other prominent indices has witnessed multiple lower circuits during this time. The Indian stock indices, both Nifty and SENSEX, have also experienced a downfall of roughly 30 per cent of market capitalisation during this lower circuit. Roughly USD 650 billion has been wiped out in a single trading session during this phase. This crisis has led to a liquidity crunch in the financial system because of cut down of active workers with reduced work hour. 
 The effects of sharp global turbulence in the financial market transmitted into Indian financial system since March 11, 2020, following the declaration of COVID-19 as a pandemic. The Indian equity market experienced buoyancy till mid-January 2020, and recorded a sharp decline thereafter. The BSE Sensex reached above 40000 level during the third quarter of 2019-20 partly because of the fall in oil price in the global market and sizeable recovery in industrial output, but started downfall during end of the last quarter of 2019-20. Substantial sell-offs in equity markets was triggered by growing risk aversion investors. The BSE Sensex fell by 2919 points (8.2 per cent) on March 12, 2020 (shown by the red reference line in Figure). The equity market experienced a sudden fall of turnover more than 10 per cent during early trading hours on March 13, 2020, that results in breakdown of the circuit and suspension of trading for 45 minutes. 

RELATED NEWS:

The worst affected sector is the aviation sector experiencing nearly 20 percent downfall after the travel ban and lockdown of the Indian economy. The declaration COVID-19 virus as pandemictriggered travel bans globally. The other major affected players in Bombay stock exchange include Tata Steel, Adani Ports, Mahindra & Mahindra, HDFC Bank, Axis Bank, Reliance Industries and the State Bank of India. Foreign investors (FIIs) are continuously withdrawing money from the Indian market.
India has been in lockdown for almost 3 weeks now. A large trunk of the workforce does not earn any money or cash. The long-term (economic) effects of the pandemic are difficult to deliberate and speculate on. But the cement and foundations of the economy are being swept away at least on the short term. When the fire shall be extinguished, will there be any vegetation, any plants left? Or will bankruptcy of the economy cause large-scale economic, social unrest.
BSESENSEXIndex 
avg Î”10 years +7.03% p.yearΔ1 year -16.96%
Sharpe ratio +0.13
geopolitical risk factor 8


GLARiUS Markets Intelligence (www.glarius.com) provides tools, prognoses and graphs to monitor performances of economies, countries and stock markets worldwide.

Tuesday, September 17, 2019

Structural Transformation, Growth and Inequality: INDIA

Mr. Panchanan Das
Professor of Economics,
University of Kolkata
Kolkata, West Bengal, India
Financial Blog in behalf of GLARiUS - wwww.glarius.com 

GLARiUS Markets Intelligence (www.glarius.com) provides tools, prognoses and graphs to monitor performances of economies, countries and stock markets worldwide.

The increases in productivity and income per capita are extremely important for development in an economy guided by the market fundamentals through the process of division of labour and expansion of trade. But the process of faster economic growth through faster proportional productivity growth creates inter-personal and inter-regional inequality. As productivity grew at a higher proportional rate than the growth in wage rate, capitalists’ surplus or profit rate moves up disproportionately raising inter personal inequality. Also, the surplus is normally transferred towards the location with easy access to capital and skilled labour, and better state support for infrastructure and tax concessions. The productivity of workers with better technology in the developed regions is higher and thus wages are also higher compared to those in less developed regions using inferior technology in producing similar products. In this way faster productivity growth in a market based economy may create inter-regional inequality.


Related: 

Labour unions up in arms against proposed amendments to Industrial Disputes Act


The union government of independent India initiated experiment with planning at the beginning of the 1950s, but it was effectively suspended in 1991 with the beginning of the liberalisation process. One explicit objective of the experiment was to limit the economic power of the elite within the frame of a mixed economy. The first three decades of planning (1950s to 1970s) was associated with a marked decrease in inequality that had prevailed during the colonial period. In particular, the growth rates of real income of the rich, the super-rich, and the ultra-rich, as defined in Banerjee and Piketty (2005), declined significantly, even as average income grew slowly. The situation changed dramatically in the early 1980s, which marked the turning point for the dynamics of income inequality in India and indeed across the world. While average income grew faster since the mid-1980s than it had in the planning period, inequality increased rapidly primarily because of an enormous increase in incomes at the top, particularly incomes at the very top (Basole, 2014). The top 1 percent in income distribution owned roughly 9 percent of the national income in India in the late 1990s (Banerjee and Piketty 2005). 


Related: 

Income inequality gets worse; India's top 1% bag 73% of the country's wealth


The structural transformation of the Indian economy from a socialistic to a pro-business path was well-underway before the 1991 reforms. The new economy of the 1980s and 1990s, even as it delivered faster growth on average, ensured higher proportional rates of growth of top incomes as compared to the first three decades of planning. In the early 1990s, the economy of the country opened its doors to the world. Subsequently, people with accumulated, or inherited wealth benefited the most from the openness of this kind even though it is said that the middle income people are also better off in this process. But, very recently the growth rate declined and the people in the lower percentile has been slipping deeper into poverty. The pro-business policies made more wealth for the upper end while the lower end dropped down further into oblivion. Thus the price of the spectacular growth of the 1990s was equally remarkable and has been paid at least in terms of higher inequality.
GLARiUS Markets Intelligence (www.glarius.com) provides tools, prognoses and graphs to monitor performances of economies, countries and stock markets worldwide. 

References
Banerjee, Abhijit, and Thomas Piketty. 2005. “Top Indian Incomes, 1922–2000.” World Bank Economic Review, 19(1): 1–20.
Basole, A. (2014), Dynamics of Income Inequality in India - Insights from World Top Incomes Database,Economic & Political Weekly, 49(40), 14-16


Thursday, November 29, 2018

Tuesday, September 4, 2018

Fair Trade, Organic Farming and Farmers’ Income: A Recent Innovation in Developing Countries


farmersFair trade and organic farming are recent innovations playing a significant role for agriculture in developing countries. These innovations are mutually reinforcing as fair trade opens up new market prospects for organic products. Organic products have price premiums and the demand for these products is growing recently at a rapid rate globally primarily because of the health and nutritional benefits of organic food. The expansion of organic agriculture is income enhancing particularly for small and marginal farmers because they are not able to use chemical fertilizers and other chemical inputs in farming. Participation in organic farming and fair trade networks is beneficial in reducing farmers’ livelihood vulnerability. This type of farming has a potential to improve soil fertility, biodiversity and other environmental content of the ecosystem.


Domestic markets for certified organic products in developing countries are much less developed till today, with the exception of China (IFAD, 2005), while exports of organic and fairtrade products from developing countries are increasing. Fair trade buyers or importers pay a price premium for fairtrade-certified products. Fair trade is beneficial for the vulnerable farmers in developing countries because it reduces the risk generated from price fluctuations as observed in the free trade. However, farmers selling certified organic or fairtrade products may not receive substantial financial benefits. This is because, although prices of organic and fairtrade certified products are greater than those of conventional products, yield of organic products is smaller than that of conventional products and thus, total revenue from organic and fairtrade products is lower than revenue from conventionally grown crops (Tina and Zeller, 2011).

One of the major challenges of organic farming is the creation of domestic demand for organic products in developing countries. While Australia, Europe and the US are the leading importers of organic products, Latin America, Asia and Africa where small land holders are predominating are the principal producers of organic and fairtrade products (Willer and Kilcher, 2011). Nevertheless, access to markets, certification, and labelling organic products still challenges in developing countries. The third-party certification systems in organic agriculture is also problematic in these countries. Organic agriculture has to be certified in accordance with the standards laid by the International Federation of Organic Agriculture Movements (IFOAM). In contrast, the fair trade standards have been taken care of by the Fair trade Labelling Organizations (FLO) International.
Organic agriculture is a feasible option in regions where labour is abundant. India is a country with high potential of expansion of organic agriculture because of its predominance of small and marginal farmers. Proper organic policy and institutional frameworks at the national and subnational level can facilitate access to domestic and export markets for certified organic products.
In India, agricultural credit is facilitated by the National Bank for Agriculture and Rural Development (NABARD), through commercial banks (50 percent), cooperative banks (43 percent) and regional rural banks (7 percent). Private sector partnerships are the key source of financing for the organic supply chains. Private companies in the supply chains, such as buyers, provide their own funding to support their partners’ activities and those companies collaborating in fairtrade agreements.

RELATED:  Small Farmers Go Big with Organic Farming

ricefieldThe post-harvest operations include handling, processing, packaging, storage and display operations need to be separate from conventional products to ensure that the organic product does not come in contact with nor have other ingredients added that might compromise its organic certification. Efficient and timely post-harvest operations at the farm and rice mill and attention to storage and transportation conditions are critical to ensuring optimal quality of the organic rice at the point of sale and for consumption. As special care is required for the storage, processing, transport and marketing of organic rice, handling costs are considerably higher than those associated with conventionally grown rice.
Fair trade organizations distribute or import products that comply with fair trade specifications. In some cases, producers sell their products to a primary cooperative, which then sells to secondary and tertiary cooperatives that subsequently export the products. At each step of the process, producers and cooperatives have to meet the standards set by the Fairtrade Labelling Organizations International (FLO).

References
IFAD. (2005). Organic agriculture and poverty reduction in Asia: China and India focus. Thematic evaluation. Report 1664. Rome, International Fund for Agricultural Development.
Tina D. Beuchelt, Manfred Zeller. (2011) Profits and poverty: Certification’s troubled link for Nicaragua’s organic and fairtrade coffee producers. Ecological Economics, 70, 1316–1324.
Willer, H. and Kilcher, L. 2011. The World of Organic Agriculture. Statistics and emerging trends 2011. Bonn, Germany, IFOAM and Frick, Switzerland, FiBL.

Mr. Panchanan Das
Professor of Economics,
University of Kolkata
Kolkata, West Bengal, India

Thursday, March 15, 2018

Property Taxation in Indian Cities – Application of Unit Area Assessment


Property tax is one of the major fiscal instruments of local governments in urban areas for raising their own revenues. Two popularly used tax bases of property taxes in India are annual rental value of the property and the capital value of the land. Most of the urban local governments use the notional property rental values as the base for assessing property taxes. In the notional property rental method, the tax base becomes stagnant, and an upward adjustment of tax rates is the only way to increase revenues from the property tax (Bagchi 1997, Rao and Ravindra 2002).

RELATED:  India Budget 2018: Winners and Losers


Local governments at the cities are responsible for designing instruments to finance their activities with the 74th Constitutional Amendment Act (1992). Many urban local governments have initiated reforms to improve the property tax system. The reforms in property tax focus primarily on improving the tax base and the administrative mechanism on of the tax. The municipal governments in a number of Indian cities have adopted the capital value of property method since 2004. In this method, values per unit of land are estimated, and the tax base is the product of this unit value and land area, plus the value of the property determined by some multiplicative factors.  It is highly unlikely that the potential gains of the new method have been fully realised partly because of the absence of a well-functioning real estate market for accurate information on property values and high transaction costs that adversely affect land prices.


Historical prices of real estate worldwide (45 countries) can be found on www.glarius.com.
The Kolkata Municipal Corporation (KMC) and Newtown Kolkata Development Authority (NKDA) have adopted recently the Unit Area Method of Property Tax. The urban local bodies of Delhi, Bangalore and Pune also have introduced the capital value system in their property tax assessment. This system is simple and transparent, and property owners can assess their tax and submit the returns. In this system, tax for a particular property is based on the annual value of the property obtained by multiplying unit area value assigned to the localities by the covered area of the property and the multiplicative factors for occupancy, age, structure and use. Multiplicative factors account for the wide heterogeneity among properties within a conceptual block. This system is expected to reduce disparity in assessment of similar properties within the same locality and thereby ensures equity to the taxpayers, efficiency in tax collection, neutrality in resource allocation, and accountability of tax officials. Equity in property taxation is horizontal or vertical. Vertical equity refers that a tax should be progressive in income or wealth. Horizontal equity, on the other hand, refers that taxpayers with equal ability to pay ought to have similar tax burdens.
Daily movements in stock markets, 10-year and 25-year averages of the main stock market indices like IBOVESPA, BSE Sensex, RTSi, Dow Jones and 40 more can be followed on www.glarius.com

RELATED: Use property tax collected over years to develop colony: Ansal to MCG


References
Bagchi, A. (1997). “Reforming the Property Tax Base: Need for a New Direction.” Economic and Political Weekly, 32(47): 3005-3010
Rao, U.A.V and A. Ravindra, (2002). Reforming the Property Tax, New Delhi: UNDP

Mr. Panchanan Das
Professor, Department of Economics
University of Calcutta

Saturday, July 8, 2017

Goods and Services Tax in India: Some Basic Issues


Goods and Services Tax (GST) is a multi-stage indirect tax levied on local consumption. It involves collection by registered vendors throughout the production and distribution chain before the goods or services reach end-consumers. Under the GST framework, each registered vendor charges GST on his sales in the form of output tax, and reclaims credits for the tax paid on his purchases as input tax. The input tax credit method allows GST-registered businesses to claim tax credit to the value of GST they paid on purchase of goods or services as part of their normal commercial activity. It is similar to value added tax because at every stage, tax is being paid on the value addition. Taxable goods and services are not distinguished from one another and are taxed at a single rate in a supply chain till the goods or services reach the consumer. The total amount of GST paid to the tax authority by all the vendors in the production and distribution chain is equal to the amount of tax finally borne by the consumer. 

The GST is a system of indirect taxation introduced from July 1, 2017, in India merging most of the existing taxes into single system of taxation. It was proposed first by the finance minister in the budget speech in 2007 and introduced by The Constitution (One Hundred and First Amendment) Act 2016. The Constitution Amendment Bill, 2014, (GST Bill), by considering the present federal structure, proposed dual GST model in which both the central and the state governments have power to collect tax in the following manner: The Central GST (CGST) and Integrated GST (IGST) are the domain of the central government, while the State GST (SGST) is to be collected by state governments. The CGST and SGST are applicable in the case of intrastate trade of commerce, but in interstate trade the IGST is applicable. The transaction may be liable to be taxed under GST if the total turnover (of all transactions all over India) exceeds the threshold limit.

RELATED: Little India struggles with tax revolution
The current indirect tax system, particularly the retail sales tax, covers normally goods but not services. Services sector, however, is faster growing part of the economy. The GST covers services as equally as goods extending the tax base of the country. The GST, a comprehensive consumption tax levied on the supply of all goods and services, can eliminate the multiplicity of taxes, the complexity in compliance obligations, and tax cascading. It is one point single taxation based on the principle of one tax one market across the regions in India. The GST eliminates the cascading effects of CENVAT and it is not simply a VAT plus service tax but an improvement over the previous system of VAT and disjointed service tax.
The GST, a multi-stage indirect tax levied on local consumption, as proposed by the union government in India has been a subject of intense debate and is reignited because of the heterogeneity of state laws on the present VAT (value added tax) system. There has been a lot of heterogeneity not only in VAT rates but also in the mode of compliance with different set of laws in different states. One of the major objectives of the proposed GST is to eliminate this heterogeneity across the states. Moreover, a number of positive impacts of GST have been claimed officially from the experience of the GST system already prevailing in more than 150 countries in the globe. While the most of the GST systems across the world have been using a single GST, a dual-GST model is proposed in India for its federal republic structure. Lot of debates have come up on GST in India particularly in the context of the state economies under the present federal structure.

As the GST is destination-based, there would be an outflow of tax revenue under this tax system along with goods and services produced in states with manufacturing industries to states that consume the goods and services. In this sense, GST may not be attractive particularly for manufacturing states. The central government has assured states of compensation for any revenue losses incurred by them from the date of introduction of GST for a period of five years.
Taxation on the consumption of goods and services is nothing more than an expenditure tax, very much similar to income tax. For GST, the tax base is expenditure, not income, and everyone who consumes goods and services cannot avoid this tax, as it is built into the price. As the lower income people have higher propensity to consume than the higher income people, the tax burden for the lower income people will be higher than for the higher income group. At least on equity ground GST should be linked to direct taxes. Tax reforms should be aimed at augmenting revenue to assure alleviation of poverty and creating a more equitable society.
Daily changes, 10-year and 25-year averages of the main stock market indices like IBOVESPA, BSE Sensex, RTSi, Dow Jones and 40 more can be followed on www.glarius.com


Mr. Panchanan Das
Professor of Economics,
University of Kolkata
Kolkata, West Bengal, India